
Updated for today’s CPG supply chains
Originally published Aug 1, 2023 | Updated for 2026 relevance
In consumer packaged goods, inventory decisions ripple across the entire organization. A single misaligned forecast, packaging refresh, or retailer reset can turn perfectly usable product into excess — or worse, obsolete stock. And once that happens, the financial and operational consequences escalate fast.
The old management phrase “You can’t manage what you can’t measure,” rings true here and its relevance has only grown as CPG supply chains become faster, more complex, and more margin-sensitive.
For Supply Chain, Sales, and Finance leaders, benchmarking excess and obsolete inventory is no longer a “nice to have.” It’s a prerequisite for understanding whether your recovery strategies are working, how much value you’re preserving, and where operational friction is silently eroding profit.
In this post, we’ll reference recent industry research and data to outline:
• Definitions of obsolete inventory in today’s CPG environment
• Core KPIs every organization should benchmark consistently
• How to set baselines for improved performance over time
For CPG professionals burdened with excess inventory management – keep reading learn how to improve your liquidation performance and turn excess into opportunity for your business.
Defining excess and obsolete CPG inventory
Before you begin benchmarking performance, you need shared definitions. Excess, obsolete, and short‑dated inventory are related but not interchangeable.
Excess inventory
Though there are many causes of excess, at its core, excess inventory can be defined as: finished goods that exceed forecasted demand and are unlikely to sell through primary retail channels. Common drivers include demand volatility, overproduction, and retailer assortment changes.
Obsolete inventory
Obsolete inventory is a subset of excess inventory. These products are no longer sellable through primary channels due to:
• SKU discontinuation
• Packaging or labeling changes
• Formula or ingredient updates
• Seasonal relevance that has passed
Importantly, obsolete inventory is often still within quality and shelf‑life standards. While it may be less urgent than short‑dated goods, it still ties up working capital and requires intentional recovery planning.
Why benchmarking liquidation performance matters
Without benchmarks, liquidation and discounting programs tend to be reactive. Teams evaluate outcomes on a deal‑by‑deal basis rather than understanding trends over time. Benchmarking liquidation performance allows organizations to:
• Quantify the impact of recovery initiatives
• Compare performance across categories and regions
• Identify where value leakage occurs
• Align Supply Chain, Sales, and Finance around shared goals
The following are just some examples of the many key performance indicators (KPIs) that are foundational to measure for effective obsolete inventory management and optimal liquidation results.
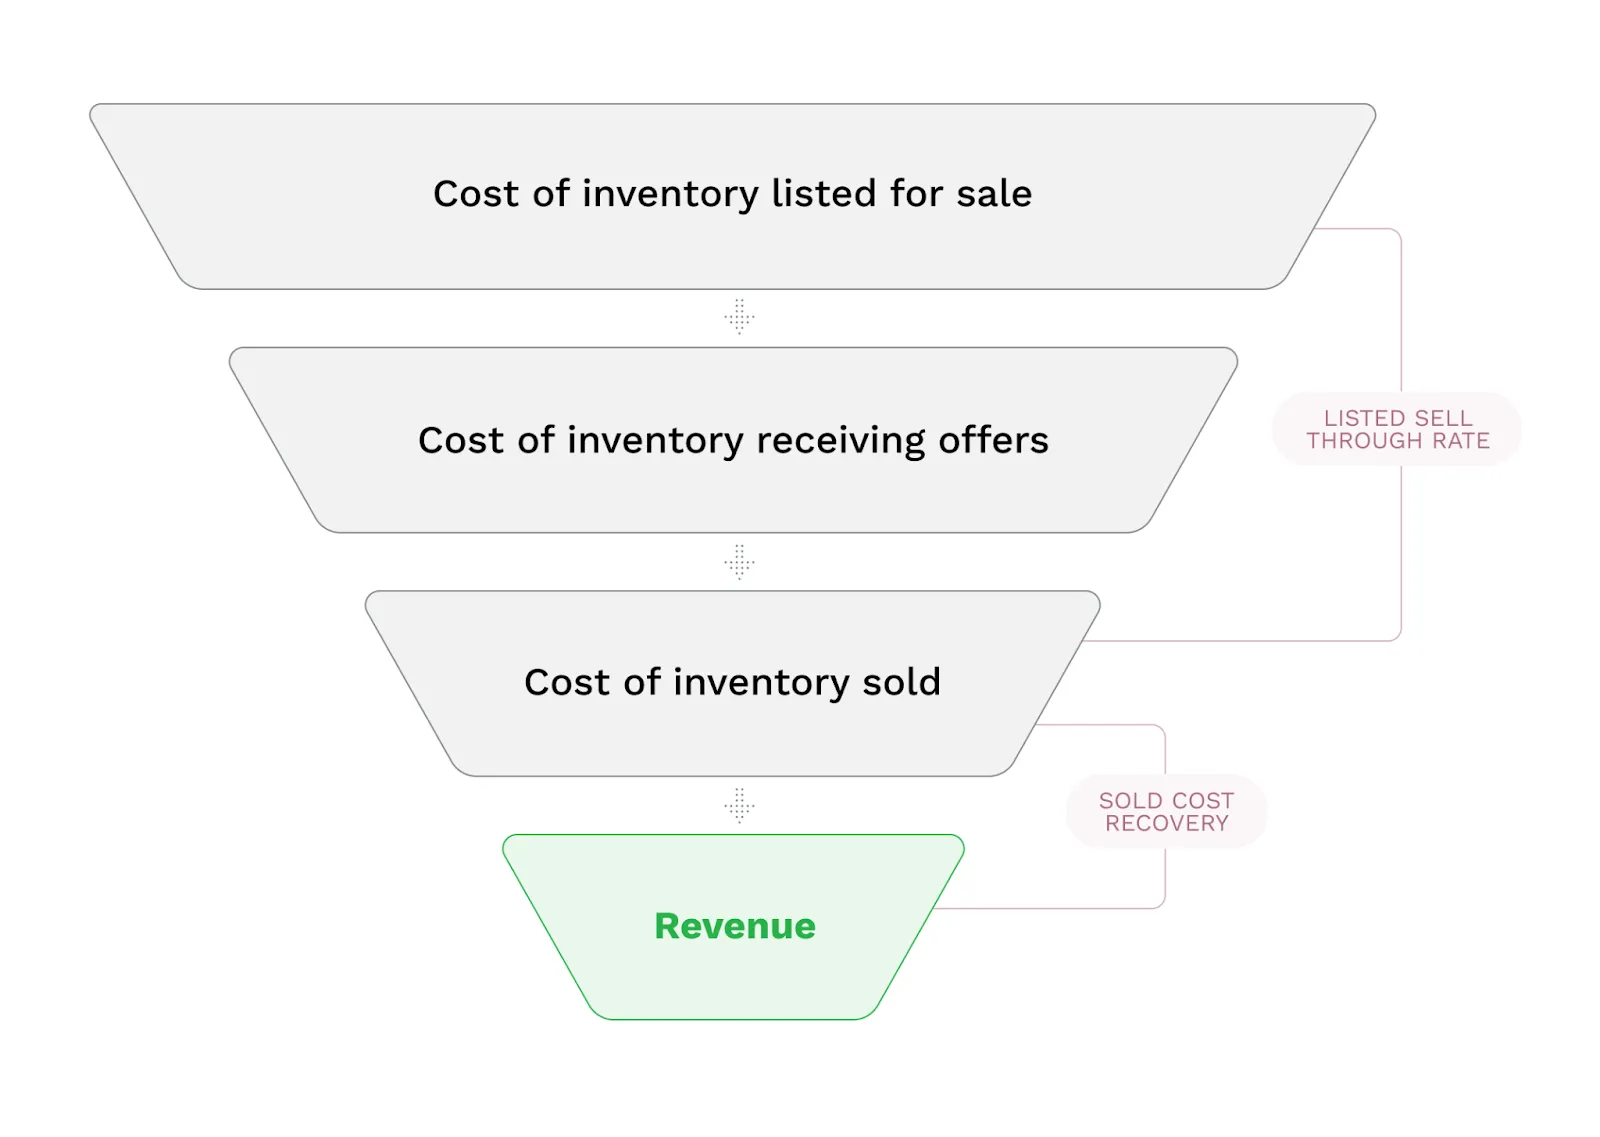
KPI #1: Inventory sell‑through rate
What is sell‑through rate?
Sell‑through rate = Cost of inventory sold ÷ Cost of available excess inventory
Sell‑through rate measures how much excess or obsolete inventory is successfully sold – rather than donated, destroyed, or written off – as a part of what was available. It can be measured by case volume or cost and is a useful metric for measuring the impact of your sales process and strength of your buyer network.
How to benchmark sell‑through rate
Benchmarking sell-through rate first requires an in-depth look at your company’s historical liquidation performance. To establish a baseline:
1. Review at least 12 months of historical excess and obsolete inventory data
2. Identify the total cost of inventory designated for liquidation, donation, or disposal
3. Isolate the portion that was sold through secondary channels
4. Divide sold cost by total available cost
Organizations often underestimate sell‑through when inventory bypasses sales channels and moves directly to disposal. By repeating this process for each liquidation cycle, patterns will begin to emerge. Standardized outcome tracking improves accuracy and visibility (especially since some inventory can skip the discounting process entirely, and instead be sent straight to donation or dump).
Inventory discounting software can help identify these gaps and give you a more accurate benchmark.
How to improve sell‑through rate
Improving sell-through rate can be one of the most challenging, but impactful, problems to solve for CPG brands and companies. With Spoiler Alert, companies like Danone, Ferrara, and more, have seen double-digit improvements in sell-through rate – not to mention, increased cost recovery, buyer network expansion, and overall efficiency in their liquidation process.
Common levers for sell-through improvement include:
• Complete inventory listings: Avoid excluding SKUs based on assumptions about buyer interest
• Improved buyer experience: Simplify purchasing workflows and clarify logistics options
• Segmentation analysis: Evaluate sell‑through by category, pack size, and region to identify patterns
Increasing sell‑through reduces write‑offs and directly improves liquidation performance.
KPI #2: Sold cost recovery rate
What is sold cost recovery rate?
Sold cost recovery rate = Revenue from sold inventory ÷ Cost of inventory sold
Sold cost recovery rate measures how much value is recovered from inventory that does sell.
If a product costs $10 to produce and sells for $7, the sold cost recovery rate is 70%. This KPI complements sell‑through by focusing on pricing effectiveness.
While sell-through rate gives more insight into what is and isn’t selling, sold cost recovery narrows in on the goods that did sell and illustrates what value you’re getting from your liquidation program.
How to benchmark sold cost recovery
With sold cost recovery, benchmarking is straightforward:
• Aggregate revenue from secondary sales
• Calculate COGS for the same inventory
• Divide revenue by cost
Many teams track this metric by category or channel to better understand pricing dynamics and manufacturers often strive to improve through finding the best price point for their unique network of customers.
How to improve sold cost recovery
Increasing your sold cost recovery rate can be challenging, but it’s ultimately one of the biggest influences on the financial performance of your discounting program. Separately, improvement strategies can (and do) differ by product type:
• Food and beverage: Earlier engagement with secondary markets often improves recovery due to longer remaining shelf life
• Non‑food CPG: Broader buyer networks and competitive demand typically drive stronger pricing
Consistency matters. A regular product listing cadence and improved (even AI-powered) offer sheets can outperform sporadic, messy buyer outreach – especially when shelf life is not a constraint.
KPI #3: Discounted inventory revenue
What is discounted inventory revenue?
Revenue is the total income generated from all discounted or secondary inventory sales. It reflects the combined effect of sell‑through rate and sold cost recovery.
This KPI is probably the single best summary metric to show the value of your discounting program, and is the most direct contributor in your bottom line.
How to benchmark revenue
Estimated revenue = Available inventory cost × Sell‑through rate × Sold cost recovery rate
Though this should be a relatively easy benchmark to find with trustworthy bookkeeping, when direct reporting is unavailable, revenue can be estimated using historical averages. This metric provides leadership with a high‑level view of liquidation performance over time.
How to improve revenue
Revenue trends must be interpreted carefully. Declining revenue may indicate improved upstream inventory management rather than weaker performance, but knowing that sell-through rate and sold cost recovery are levers that can positively impact revenue can set you on a path to success. Regardless, cross‑functional visibility is critical to understanding root causes.
It’s also important to note that the total cost of your available inventory also factors in here. Your cost recovery and sell through rates can both increase, but if you have less available inventory to start with, your revenue could still decrease. This isn’t cause for alarm, as it could mean your organization is doing more to identify and sell inventory before it becomes obsolete.
Comprehensive reporting and data analytics tools can help manage your available inventory and communicate across business units so that you can see when a reduction in discount revenue is caused by inventory being sold into primary channels.
Benchmarking supports continuous improvement
All discounting programs can benefit from ongoing optimization, especially those that don’t have standardized documentation or procedures and benchmarking is a great place to start. Benchmarking obsolete CPG inventory is not about optimizing a single liquidation event. It is about establishing baselines, measuring trends, and continuously refining recovery strategies.
Organizations with standardized KPIs are better positioned to:
• Reduce inventory write‑offs
• Improve sustainability outcomes
• Protect margin during demand volatility
As CPG supply chains grow more complex, disciplined benchmarking can no longer be optional, but resourcing the work is also increasingly challenging. Through solutions like Spoiler Alert, brands and manufacturers can rest easy knowing that there is an organized, data-driven system in place to take your liquidation performance to the next level.
Explore more resources on improving liquidation performance, buyer relationships, and excess inventory recovery in Spoiler Alert’s resource library.
