
Every CPG company knows excess inventory is a cost center, and an expensive one at that. Write-offs, disposal costs, carrying costs for obsolete inventory, the opportunity costs of moving sales teams off primary channel trade programs to put out fires – these add up fast.
At Spoiler Alert, we help many of the world’s top CPG manufacturers – Kraft Heinz, Pepsico, Unilever, and more – to better manage their excess inventory, and one of the biggest barriers to mitigating these costs is timing.
Our data shows that the longer you wait to liquidate, the more costs you’re giving up, and the more likely you are to resort to disposal. Perhaps that’s obvious, but it’s also easier said than done. That’s also why one of the most commonly asked questions we receive is how to know exactly when to start moving that inventory into the secondary market to maximize the costs these brands can recover.
It’s such a frequently asked question because it’s a black box for the vast majority of CPG supply chain teams. They know earlier is better and they know short-dated product gets punished on price. But the specific number – the minimum days of remaining shelf life where cost recovery and sell-through both hold up – is elusive, varying by product category.
Across $6B in liquidation transactions on our platform, spanning 85+ product categories and hundreds of buyer relationships, we've seen the liquidation decisions that drive the highest cost recovery and sell-through, and we built an easy-to-use formula that you can apply to your products so you can make those informed decisions yourself.
Let’s walk through that formula and how you can use it to calculate the minimum shelf life for any product category, the variables that shift it, and how to build it into your CPG inventory management process.
Shelf life remains the hidden variable in liquidation economics
Supply chain teams think about shelf life constantly, and almost exclusively through the lens of the primary channel: retailer guarantee dates, FEFO rotation protocols, and warehouse compliance thresholds. In these channels the rules are well-established, where most retailers require 67-80% of a product's total shelf life remaining at delivery, depending on category. Miss that window and you're looking at rejected shipments or forced markdowns.
Closeout buyers, on the other hand, operate on completely different dynamics. Discount retailers, off-price grocers, and liquidation buyers will accept product much closer to expiration; that's the whole point of their value to the consumer. But "closer to expiration" doesn't mean "anything goes." A discount retailer might set their customer guarantee date at 30 days from expiration, compared to 90 days at a traditional grocer. They still need to receive the product, get it distributed to stores, and give it enough time on the shelf to actually sell.
The problem is that most brands don't have the visibility to map out the right timeline. They manage shelf life for the primary channel, and when product falls outside that window, there isn't enough runway left for that buyer to bid, negotiate, ship, and shelve that product.
That's when cost recovery collapses. Buyers discount aggressively on short-dated product because their own sell-through risk goes up. The data across our platform shows a strong, consistent pattern: remaining shelf life is perhaps the single biggest driver of what a buyer is willing to pay. Every week a brand waits to act, the recovery rate plummets.
What we’ve also found from our transaction data is that there exists a shelf life inflection point within most categories where cost recovery and sell-through is optimal, and begins to nosedive after that point is crossed.
*For ease of aggregation, we’ve grouped all categories into departments as they’d be organized within a retailer (Snacks, Pantry, Dairy & Eggs, etc.).
The formula for optimal CPG liquidation
We like to frame this starting at the consumer and working backward. Every step between your warehouse and the consumer's kitchen takes time, and each one eats into your remaining shelf life.
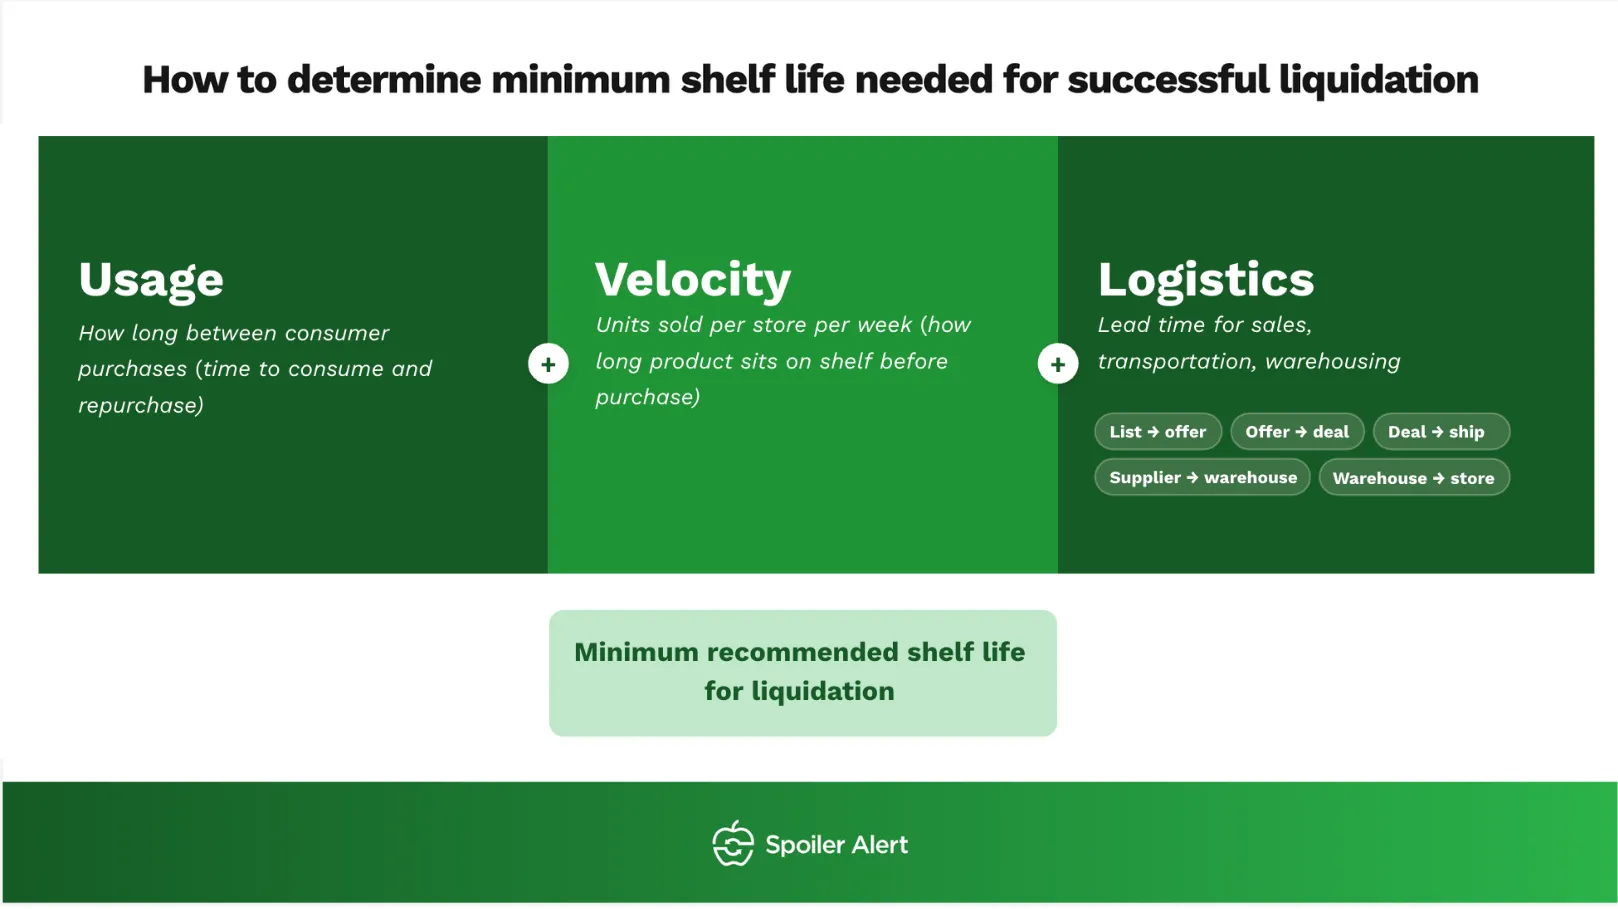
The formula for maximizing liquidation odds and cost recovery can be broken down into three buckets: usage, velocity, and logistics.
Minimum shelf life needed = Logistics (Bidding and negotiation lead time + Shipping + Buyer warehouse-to-store distribution) + Velocity (the time it takes to sell on retail shelves) + Usage (Consumer consumption window after purchasing)
Deal close lead time covers everything from the initial offer to an accepted deal – negotiation, paperwork, and logistics coordination. With an established buyer relationship, this typically runs 1-2 weeks. New relationships or complex lots take longer.
Shipping to buyer includes freight coordination and transit. Depending on geography, carrier availability, and whether you're shipping full truckloads or partials, expect another 1-2 weeks.
Buyer warehouse-to-store distribution accounts for the buyer's internal logistics from their distribution center to retail locations, and generally adds another 1-2 weeks.
On-shelf selling time depends on how fast the category turns in a discount retail environment. Snacks and beverages move quickly whereas specialty items and niche SKUs often sit longer. As such, this variable swings the most by category. When paired with our inflection data, however, these category-specific variables can be made more visible.
Consumer consumption window is the final piece. The treasure-hunting shopper buying discounted products still expects a reasonable amount of time to use it at home. Few will willingly grab a box of crackers with one day left on the date, and buyers need to account for that.
To put this formula all together for a large category like snacks, for example, brands need:
- 1-2 weeks to close a deal +
- 1-2 weeks of freight +
- 1-2 weeks of buyer distribution +
- Realistic sell-through velocity and at-home consumption time.
For this example, that lands at roughly 60 days as the minimum shelf life needed to maintain meaningful cost recovery on the excess inventory.
How the formula shifts by category and temp class
Sixty days works for snacks, but not quite for beverages, frozen categories, or personal care. The formula's output changes by category because every variable within – logistics lead time, consumer usage, and especially on-shelf sales velocity – behaves differently depending on what you're selling and how it's stored.
Our platform data across 85+ categories reveals the department-specific inflection points where cost recovery drops off.
For many top departments on our platform, the relationship between shelf life and cost recovery follows the pattern most supply chain planners would expect: more shelf life correlates with higher recovery, with a clear drop-off below a specific threshold.
The figure below demonstrates this pattern of cost recovery against remaining days of shelf life upon offering a product on Spoiler Alert, as observed by our transaction data.

- Snacks and candy both inflect around 60 days, with recovery falling sharply below that mark.
- Dairy and eggs carry shorter shelf lives by default, and every additional day of runway at liquidation drives measurable recovery lift.
- Pantry products tell a different story entirely. Buyers in this category often apply shelf life filters in 120-day increments, which means a two-week delay in listing – from 245 days down to 231, for example – can cross a threshold that materially changes the recovery outcome.
- Beverages need even more runway, with performance peaking around 240 days and declining rapidly below 180.
While there is no single shelf life number that guarantees optimal liquidation performance, these inflection points, used as inputs in the formula above, can give you a starting point for your own product in determining the best shelf life at which to consider secondary channels.
We launched a secondary market report that dives deeper into the optimal times to liquidate within each of our top ten departments, as well as how quickly deals with buyers close after listing on Spoiler Alert. Read the latest in liquidation here.
Knowing your shelf life number is half the equation
The formula gives you a shelf life target for every department in your portfolio. Start at the consumer, work backward through on-shelf velocity, buyer distribution, freight, and deal lead time, and calibrate against the inflection points your category data reveals.
From our experience, missing your category's inflection point by even a single sales cycle and the recovery curve punishes you. Below those thresholds, fewer buyers bid, and the ones who do price in their own sell-through risk, which means steeper discounts on your end.
The harder operational question is who's on the other side of that listing. The secondary channel runs through hundreds of discount retailers, wholesalers, and specialty buyers, each with distinct category appetites, temperature capabilities, regional footprints, and shelf life tolerances. A snack brand listing at 65 days needs buyers whose purchasing cycles, distribution speed, and store velocity can absorb that product within the window – all while maintaining brand integrity and protecting from channel diversion.
Matching the right inventory to the right buyer at the right shelf life, repeatedly and at scale, is where most teams run out of bandwidth.
Spoiler Alert helps CPG suppliers build the right relationships with 270+ active buyers across every temperature class and product category, with platform pricing intelligence and transaction data from $6B in liquidation activity to inform when and how to list your excess inventory.
If you want to pressure-test your category's shelf life thresholds against what we're seeing across the network, we'd welcome that conversation.
.png)
